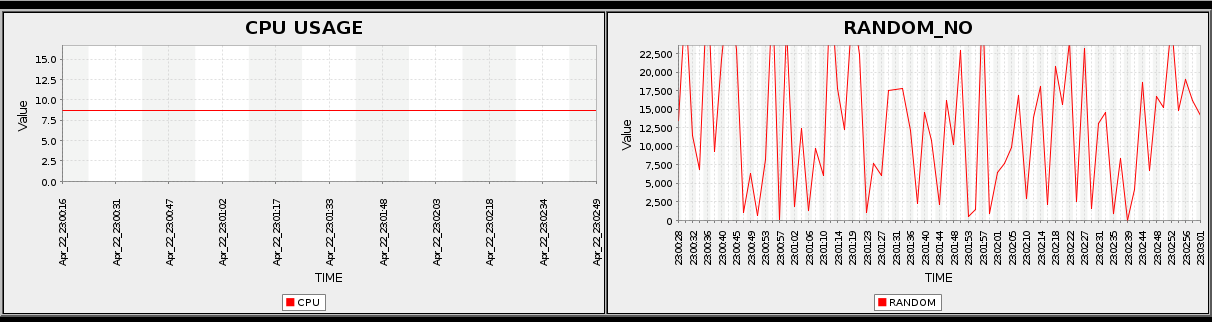
This setup lets user to plot any comma separated values at real time. The plotted chart is published on a webpage.
This is a good tool to show realtime statistics.
Special Thanks to JFreeChart.
Please go thru "http://www.jfree.org/lgpl.php"
Technically the client needs to broadcast (on UDP) comma separated values to server being used to process chart and push to a webpage. The intermediate dataProcessor will capture the data. The chartProcessor will process and create images (every X interval for last Y data) and webpage/html will display the chart.
Their are various options to display chart, order charts, group charts etc.
This is an attempt to simplify Real Time Charting solution. What I would do to make it work 1. Download complete bin folder first 2. Download chart.properties 3. Download Either Monitor.war within dist directory or create a new web Archieve using src/WebContent/build.xml/build.properties 4. A Client Script is a must for demo. If I happen to receive any request, I will upload a sample client script. Meanwhile, there is a sendUDP.pl that should help. Perl is not necessary. I have seen my associates coding in Java and plain bash to ceate client scripts. 5. Adjust chart.properties based on needs. 6. Read how to setup Real time monitors from docx uploaded at same location. This is an ongoing process. Any Suggestion for improvement is appreciated and will be done. Also, the code is so simple, anyone can actually change and run. Would appreciate if any generic feature is communicated back to me so that I could upload it for the world. Please note, This project would not be possible without JFreeChart. I have not upgraded to JFreeChart latest release but I intend to do so in future, based on response.
Go For it --> SOURCE CODE AND PRODUCT Thanks Aman ZeeK Verma